Web Interface
The application has two main surfaces: the setup screen and the visualization workspace.
Setup Screen
Use New Project for local files and Example Library for bundled data. The backend status badge explains whether upload processing and tree inference are available.
In GitHub Pages demo mode, generated examples can open without a backend. Uploads and backend-driven example processing still require the local source checkout, Docker full stack, or optional desktop backend.
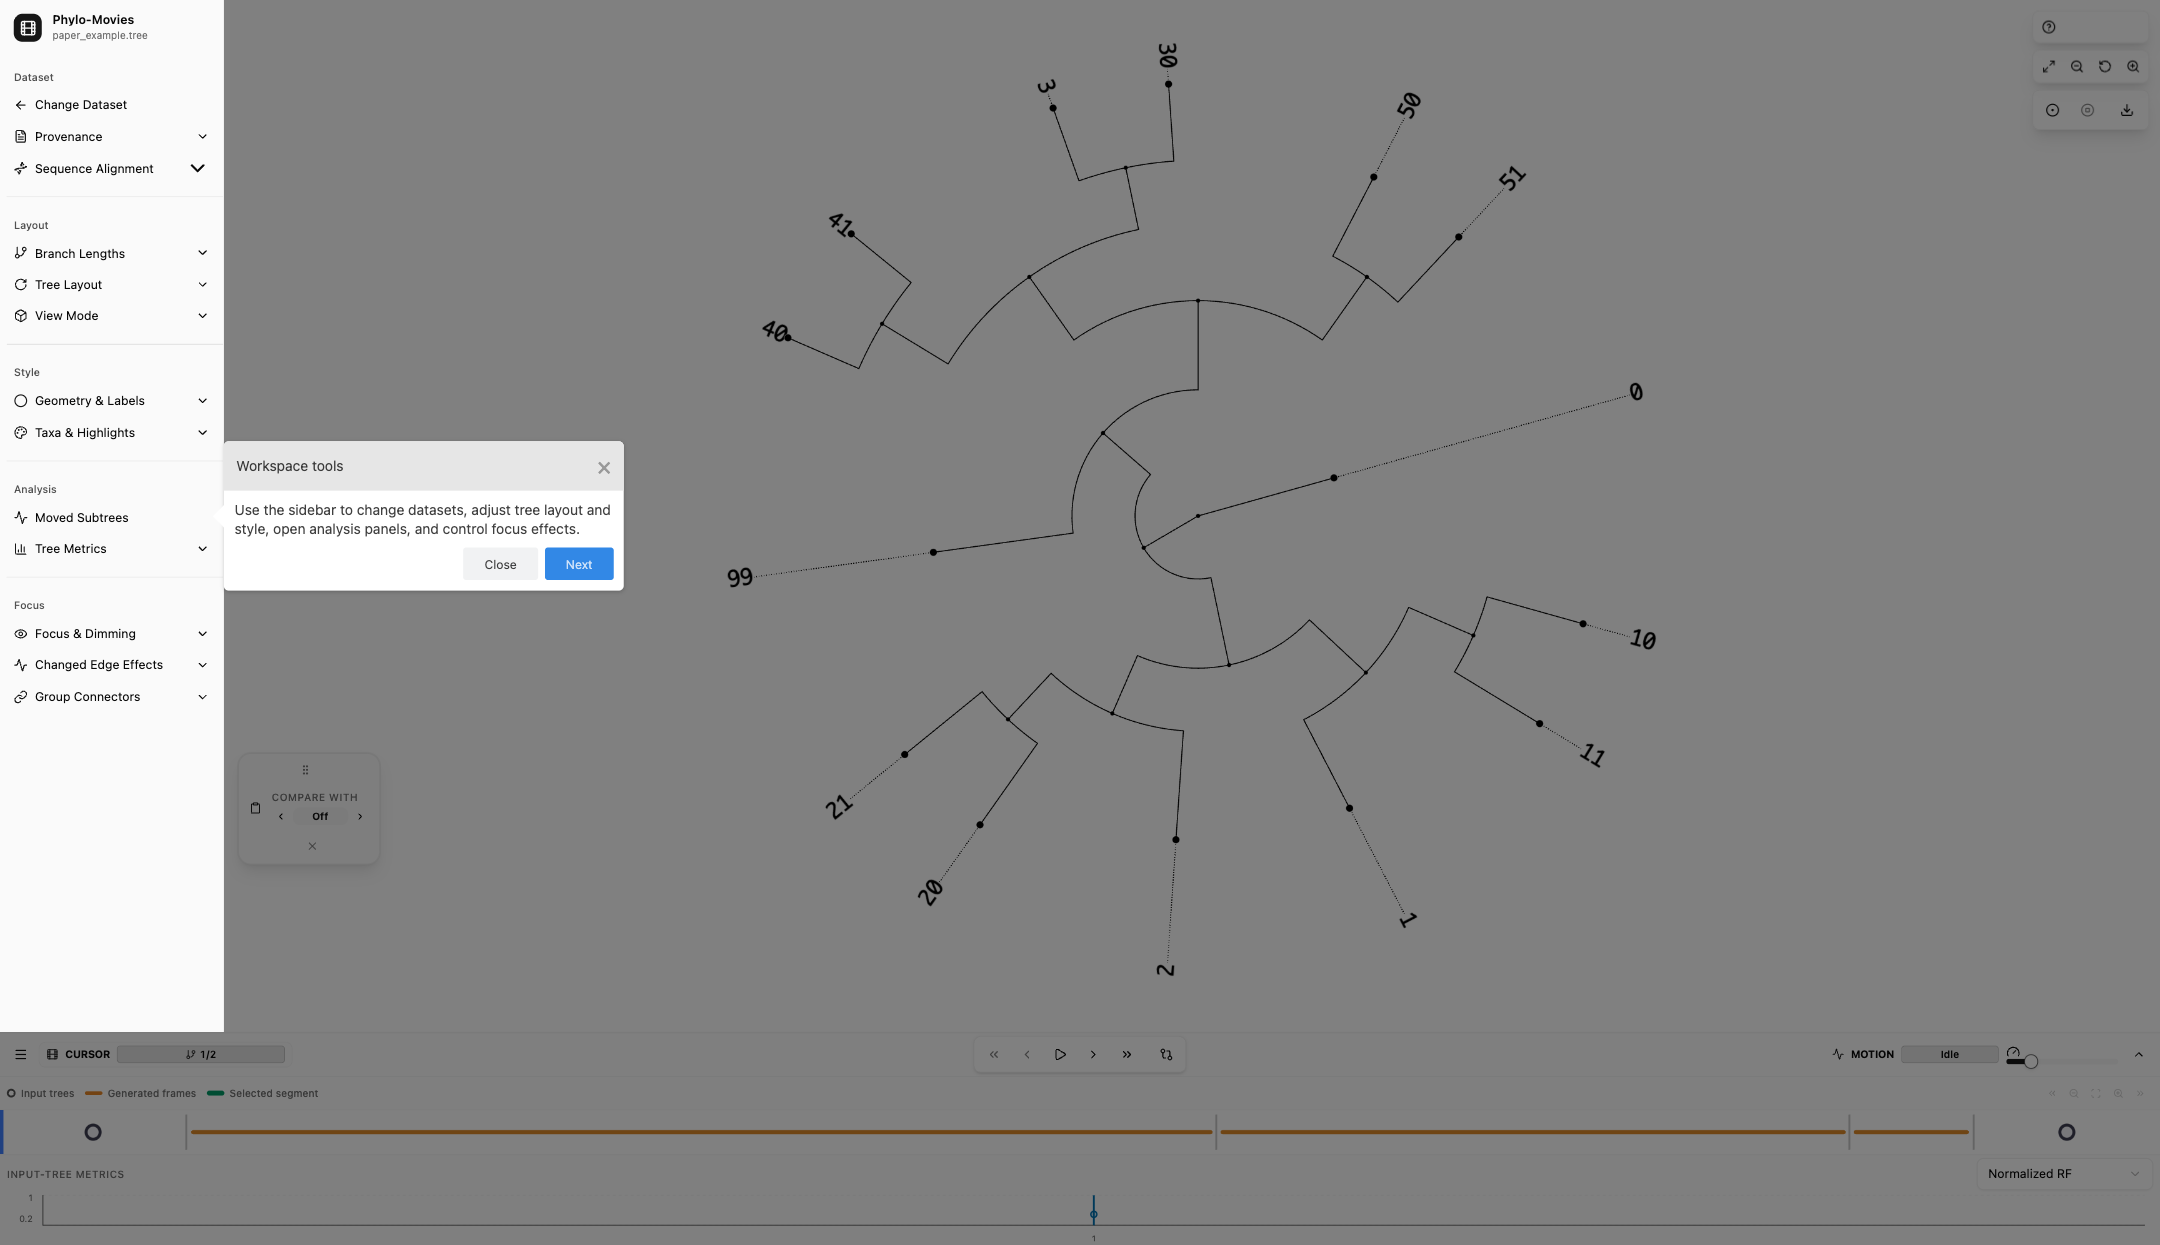
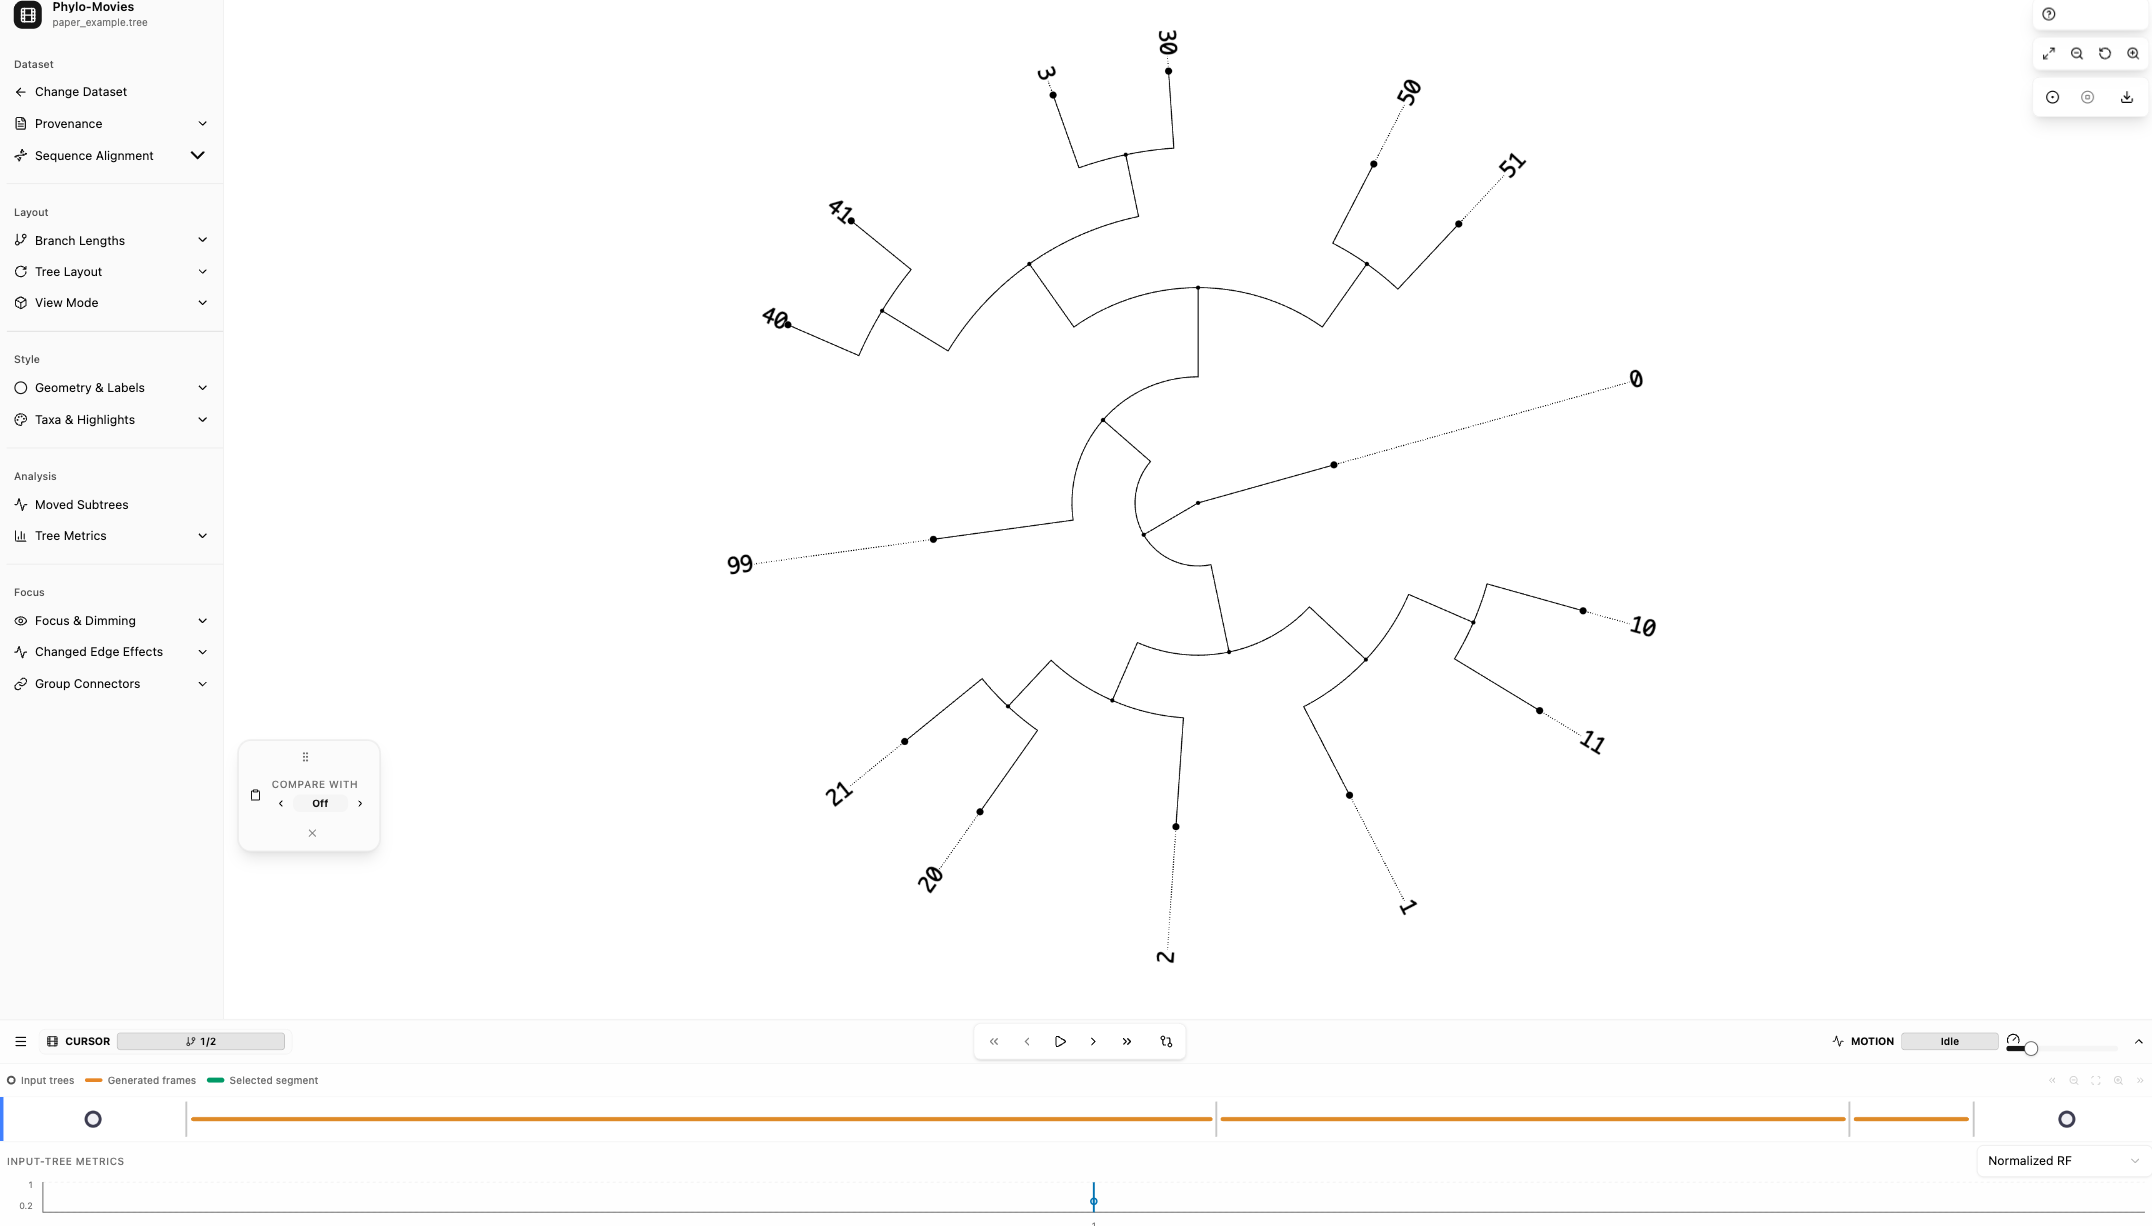
Visualization Workspace
The workspace is organized around the tree canvas, sidebar, and movie timeline.
| Area | Purpose |
|---|---|
| Sidebar | Dataset, layout, style, analysis, and view controls. |
| Tree canvas | Main deck.gl visualization for the current tree or comparison view. |
| Canvas controls | Fit, zoom, reset, PNG export, and WebM recording. |
| Movie timeline | Input tree markers, generated frames, transport controls, speed, and charts. |
| Transition Inspector | Detailed report for the selected topology-change segment. |
| Floating windows | MSA viewer, taxa coloring, and SPR analytics when available. |
For detailed settings and methods, see the Feature Reference.
Manual Workspace Tour
After a visualization is loaded, use the Help button in the workspace to start the guided tour. The tour highlights the main workspace areas without changing data, starting playback, recording, or downloading files.